| Acceleration
& Deceleration of a Trend
 Market
Acceleration and Deceleration is a concept of watching
the markets price activity for strength and weakness.
Much like an automobile accelerates and decelerates
through city streets, the market reacts the same way.
Investors need to learn to watch for this type of market
price activity because it can help guide them to greater
profits. Market
Acceleration and Deceleration is a concept of watching
the markets price activity for strength and weakness.
Much like an automobile accelerates and decelerates
through city streets, the market reacts the same way.
Investors need to learn to watch for this type of market
price activity because it can help guide them to greater
profits.
Well
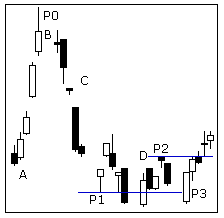
use the charts above to attempt to illustrate how the
market accelerates and decelerates within a trend. I
like to use analogies to bring home a point and so the
readers will have something to associate with as Im
explaining something. For this case, I will use a train
moving into a train station. As the train moves into
the train station, it slows, then stops to let people
off. After the new passengers load into the train, it
begins to accelerate to its new destination.
A.
Now lets apply this analogy to the market price of the
chart above. As the market nears the end of its previously
bearish trend, the size of the black candles begins
to shrink as the trend decelerates. Then, the market
trend reverses and begins to accelerate upward as the
bullish trend strengthens. As the bullish trend accelerates,
notice how each trading session is able to close near
the high of the session. This is a good sign that the
market is continuing to accelerate upward.
B.
The last white candle of the first bullish trend shows
the market is beginning to decelerate with its inability
to close near the high of that session. Then, the following
session is a black doji line that indicates the bullish
trend has possibly ended and the market might reverse.
This doji line forms a Bearish Harami pattern (P0) formation
that provides us further indication the market may move
downward.
C.
The next candle is a large black candle that confirms
the bearish harami line and shows us how quickly the
market intends to take back the bullish ascent. After
this big black bar, another small black candle forms
(which is actually a black lower shadow). This small
black candle is still a bearish candle, but does not
show us the market is continuing to accelerate downward.
The interesting thing though is that the small black
candle formed with a bearish gap between it and the
previous candle another strong bearish sign. Then, the
following candle is a very large black candle that closed
near the low of the session a good sign of bearish acceleration.
Lastly, another small black candle formed again the
market shows us that the bearish trend may not continue.
P1.
At this point a White Hammer forms that gaps below the
previous black candle. The hammer itself indicates that
this may be the beginning of a potential market bottom.
If we look back at the bearish trend, well notice that
there are three distinctive gaps that have occurred
within the trend a Bearish Three Gaps Pattern. We know
that the bearish three gaps pattern means that the bearish
trend will likely exhaust at some point in the future.
The next candle to form is white and again gaps above
the white hammer. This new pattern formation is a Three
River Morning Star pattern a potential bottom formation
and a clear identification of market support (shown
by the blue line).
Notice
that an Engulfing Bearish pattern formed shortly after
the Three River Morning Star pattern. The reason I mention
this is because this Engulfing Bearish pattern is actually
a Last Engulfing Bearish pattern because it did not
receive confirmation with the following trading session
and actually formed near the end the bearish trend.
D.
The type of price activity seen here at D is a clear
example of congestion. Nearly every other candle is
an opposite color to the prior candle and the market
price is not really going anywhere. Also, notice how
the market attempted to break the support level created
by the Three River Morning Star pattern, but the following
trading session drove it back above the support level.
This is a good sign that the support level is strong
and will likely hold.
P2.
The second pattern I would like every one to notice
is a Three River Evening Star pattern formation. This
pattern occurred shortly after the market attempted
to break the support indicated by the Three River Morning
Star pattern. This Three River Evening Star pattern
is indicating a resistance level (shown in blue) near
the high of the Doji Star pattern.
P3.
Immediately after the Three River Evening Star patters
formed, a Piercing Line pattern formed with a large
white candle that closed at the high of the session.
This type of candle is called a Long White Closing Bozu
Line one of the strongest bullish candle types. The
Piercing Line can be acted upon by aggressive investors,
although conservative investors should wait for confirmation
of the pattern.
| 
