| Finding
& Staying With Market Trends
 The
chart above is that of an international currency. The
reason I choose this chart is because the currency markets
have a characteristic of extended trending at times.
For short-term traders, these trends can be very profitable
(if these traders are not caught on the wrong side of
the trend). For position traders, monitoring the markets
overall trend is the key to a successful trade and profits. The
chart above is that of an international currency. The
reason I choose this chart is because the currency markets
have a characteristic of extended trending at times.
For short-term traders, these trends can be very profitable
(if these traders are not caught on the wrong side of
the trend). For position traders, monitoring the markets
overall trend is the key to a successful trade and profits.
As
a short-term investor, there are many opportunities
to make a quick profit on this chart. There are also
signals that may cause some losses some big and some
small. In my opinion, the trading signals found within
a market such as this can be misleading to some investors.
The Western technical indicators, such as Stochastics,
Williams Percent Retracement, and others, will quickly
reach their extreme levels and can cause investors to
trade the opposite side of the market trend. This reaction
within these indicators can cause unwanted losses to
occur and cause investors to loose confidence in the
market.
Many
means have been devised to attempt to track and stay
with the markets overall trend. One of the most common
is the use of a long term moving average, often ranging
from 50 session averages to 200 session averages. One
of the biggest problems with this technique is that
the market price crosses above and below these averages
rather late. Also, during market congestion unwanted
extreme losses can result.
The
Pattern Forecaster Plus software application uses a
couple of techniques to attempt to track and follow
the markets overall trend the Trending Candle / Body
Reversal technique, the Adjusted Stop Level Breakout
System and the Relative Momentum Index. Investors should
also choose to use an age old technique that has proven
itself over the years as well called the Weekly chart.
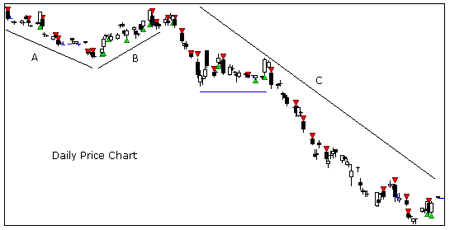
The Daily chart above illustrates the effectiveness
of the Trending Candle / Body Reversal investment technique
on a trending market.
 The
Weekly chart is one of the most important investment
analysis methods for tracking and trading the markets
overall trend. Many traders recently have begun concentrating
on the extreme short term side of the markets (in most
cases intra-day charts). By doing so, many of them have
neglected the information contained within the Daily
and Weekly charts because they are concentrating on
only one market perspective. It is imperative that all
investors use and track multiple perspectives of any
market. Without using the information contained within
the different perspectives of the market price activity,
investors are likely to misinterpret the markets trends
and the potential for the market to continue trending. The
Weekly chart is one of the most important investment
analysis methods for tracking and trading the markets
overall trend. Many traders recently have begun concentrating
on the extreme short term side of the markets (in most
cases intra-day charts). By doing so, many of them have
neglected the information contained within the Daily
and Weekly charts because they are concentrating on
only one market perspective. It is imperative that all
investors use and track multiple perspectives of any
market. Without using the information contained within
the different perspectives of the market price activity,
investors are likely to misinterpret the markets trends
and the potential for the market to continue trending.
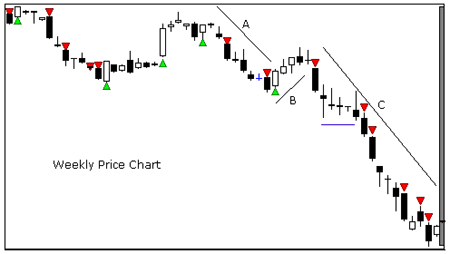
The
chart above is a Weekly chart of the same market on
the top of this page. Notice that the Weekly chart more
clearly displays the markets overall trend and eliminates
the potential false reversal signals seen in the Daily
chart as the market Breathes. Notice how clearly trends
A, B and C are defined on the Weekly chart. I know that
many of you are thinking but the Daily chart gave quickly
entry and exit signals. This is true and Im attempting
to instruct investors to use the Daily chart for the
short-term entry and exit signals. Im also attempting
to show investors how the Weekly chart can be very instrumental
in the success of many investors by providing a crisp,
clear picture of the markets overall trend.
One
other thing I should mention is how the congestion area
on the Daily chart (between trend B and C) has been
reduced to a series of small candles and Dojis on the
Weekly chart. This further illustrates why the weekly
chart can be an important tool for investors.
| 
