| The
Short-term Nature of Candlesticks
 The
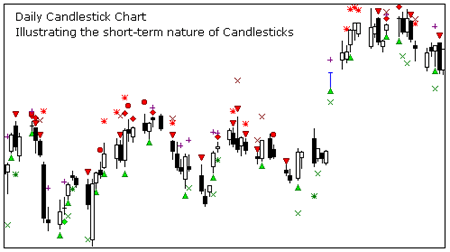
chart above is of the S&P 500 from the December
1996 contract. The price range is from 685 to 710. As
we all know the S&P has climbed over 400 points
since this contract traded. This example is simply to
illustrate how the market breathes as it continues to
trend. The shaded areas illustrate how the market breathes. The
chart above is of the S&P 500 from the December
1996 contract. The price range is from 685 to 710. As
we all know the S&P has climbed over 400 points
since this contract traded. This example is simply to
illustrate how the market breathes as it continues to
trend. The shaded areas illustrate how the market breathes.
The
market breathes as traders buy and sell the market.
There are day traders, short term traders, intermediate
term traders and long term traders that are all trying
to make money in the markets. In my opinion, the short
term and day traders are the ones that cause the market
to breathe on a short term basis. They do this by exiting
their positions to pull profits after the market has
moved a few points. They are smart traders. They are
attempting to pull profits which is a good thing.
How
does this relate to candlesticks? It relates because
the candlestick patterns are short term leading indicators
and thus will likely catch each and every potential
correction in the market whether or not the market correction
will result in a big enough price move to make a profit.
How
does an investor resolve this problem? Use the weekly
chart to review the markets overall trend and to more
clearly identify major market tops and bottoms. Every
market will eventually exhibit this type of breathing.
Investors need to be aware of these market characteristics
so they can trade more effectively. The markets breathe
just like the ocean tides fluctuate with the lunar cycles.
Some tidal changes are extensive. Others are very small.
The markets react the same way just not on a regular
schedule like the ocean tides.
| 
