| Candlestick
Bullish Three Gaps Pattern
 The
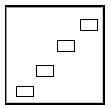
Bullish Three Gaps pattern is an exhaustion pattern
after, in some cases, and entended move. The image shown
here is an "ideal" type of illustration. Four
white candles with gaps between the range of the candles.
Another form would be when you have an extended uptrend
(5~100+ bars in a defined uptrend) and you can identify
three unique gaps in price action. It does not matter
how many bars are inbetween the gaps. All that matters
is there are three gaps in a defined trend. The
Bullish Three Gaps pattern is an exhaustion pattern
after, in some cases, and entended move. The image shown
here is an "ideal" type of illustration. Four
white candles with gaps between the range of the candles.
Another form would be when you have an extended uptrend
(5~100+ bars in a defined uptrend) and you can identify
three unique gaps in price action. It does not matter
how many bars are inbetween the gaps. All that matters
is there are three gaps in a defined trend.
Now,
when this happens, you should look for exhaustion of
the trend and potential sell/reversal signals. This
pattern shows the bullish trend should end soon, thus
you need to start looking to the best bearish trend
reversals.
If
this pattern is found after a nice long extended uptrend,
then I suggest letting the last price wave settle before
trying to "sell right in". Sometimes, the
last price wave moves quite a bit after the third gap.
It may continue up another 1~3+% before it stops.
This
pattern is a setup for an eventual bearish reversal.
It is good to use this as a warning that some bearish
move should happen in the future - just time it with
the other candlesticks and the longer-term charts.
CONTINUE
| 
