| Candlestick
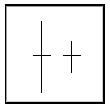
True Doji Line Pattern
 True
Doji Lines are formed when the Opening price and the
Closing price are EQUAL. It is often called a "Doji
Cross". This is the truest form of a DOJI pattern
and indicates a market congestion phase and a potential
reversal. True
Doji Lines are formed when the Opening price and the
Closing price are EQUAL. It is often called a "Doji
Cross". This is the truest form of a DOJI pattern
and indicates a market congestion phase and a potential
reversal.
When
this type of candle is found after an up trend it is
considered a potential TOP formation. When this type
of candle is found after an down trend it is considered
a potential BOTTOM formation
Notice:
Investors should continually watch for Dojis and the
Umbrella group of candles. These candle types will typically
precede a major market reversal. In fact, many investors
have told me these types of candles are some of the
most important candle types for investors to use.
Dojis
are also great indicators of SUPPORT and RESISTANCE.
Use the body level of the DOJIs as the support/resistance
level.
CONTINUE
| 
